GuideFin Rating: Why Past Mutual Fund Returns Don't Tell the Whole Story
How the GuideFin Rating works — and why we built it to be honest about what it can't tell you. Open any mutual fund app in India and you will see the same…

How the GuideFin Rating works — and why we built it to be honest about what it can't tell you.
Open any mutual fund app in India and you will see the same thing: a fund's 1-year, 3-year, and 5-year returns, maybe a star rating, and an implicit invitation to chase whichever number is biggest. It's the financial equivalent of judging a cricketer by one innings. A fund manager can look brilliant for eighteen months on the strength of a single sector bet and the app will happily rank them #1.
With GuideFin 1.3.1, we shipped something different: GuideFin Rating, our own score that is now live across the app's Mutual Fund Insight module. You will find it on the fund summary page, the category leaderboard, and head-to-head comparisons. But the score itself is not the interesting part. The interesting part is one question we had to answer before we trusted it enough to ship: if a fund ranks #1 today, does it actually beat the category tomorrow? We tested that exact claim against our own historical data, expecting it to hold up. It did not, not by more than statistical noise. That finding did not kill the feature. It is the reason the feature looks the way it does today.
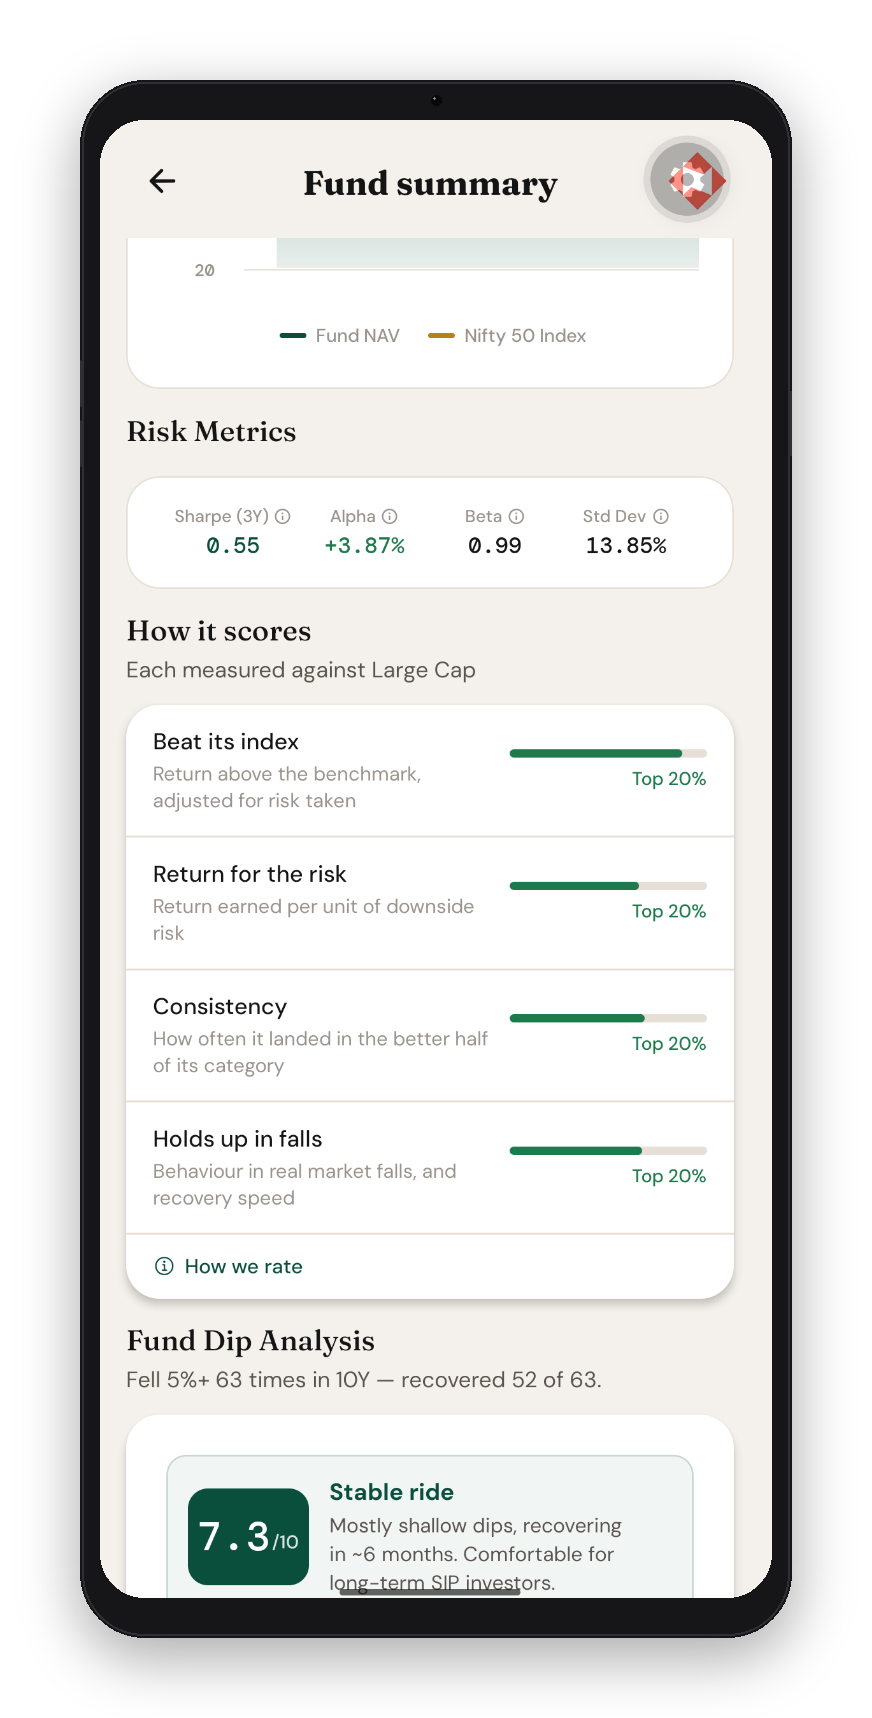
summary page leads with its category rank — here, Nippon India Large Cap Fund at #1 of 21 rated Large Cap funds.
What actually gets measured
GuideFin Rating scores every Direct-Growth mutual fund on four factors, each computed across roughly 25 overlapping 3-year windows spanning the last five years, not just the most recent stretch:
Beat its index (35% weight) — alpha, the return earned above the category benchmark after adjusting for risk taken, using the median across all windows so one lucky year can't carry a fund.
Return for the risk (25%) — Sortino ratio, return earned per unit of downside risk. Upside swings aren't punished; only falls count against a fund.
Consistency (20%) — in how many of those 25 windows did the fund land in the better half of its category?
Holds up in falls (20%) — how the fund actually behaved during real market corrections, and how quickly it recovered.
Every factor is z-scored within its own category — a Small Cap fund is only ever measured against other Small Cap funds, never against a Large Cap or a debt fund. Hybrid funds shift the weighting toward downside control, since managing risk is closer to their actual job.
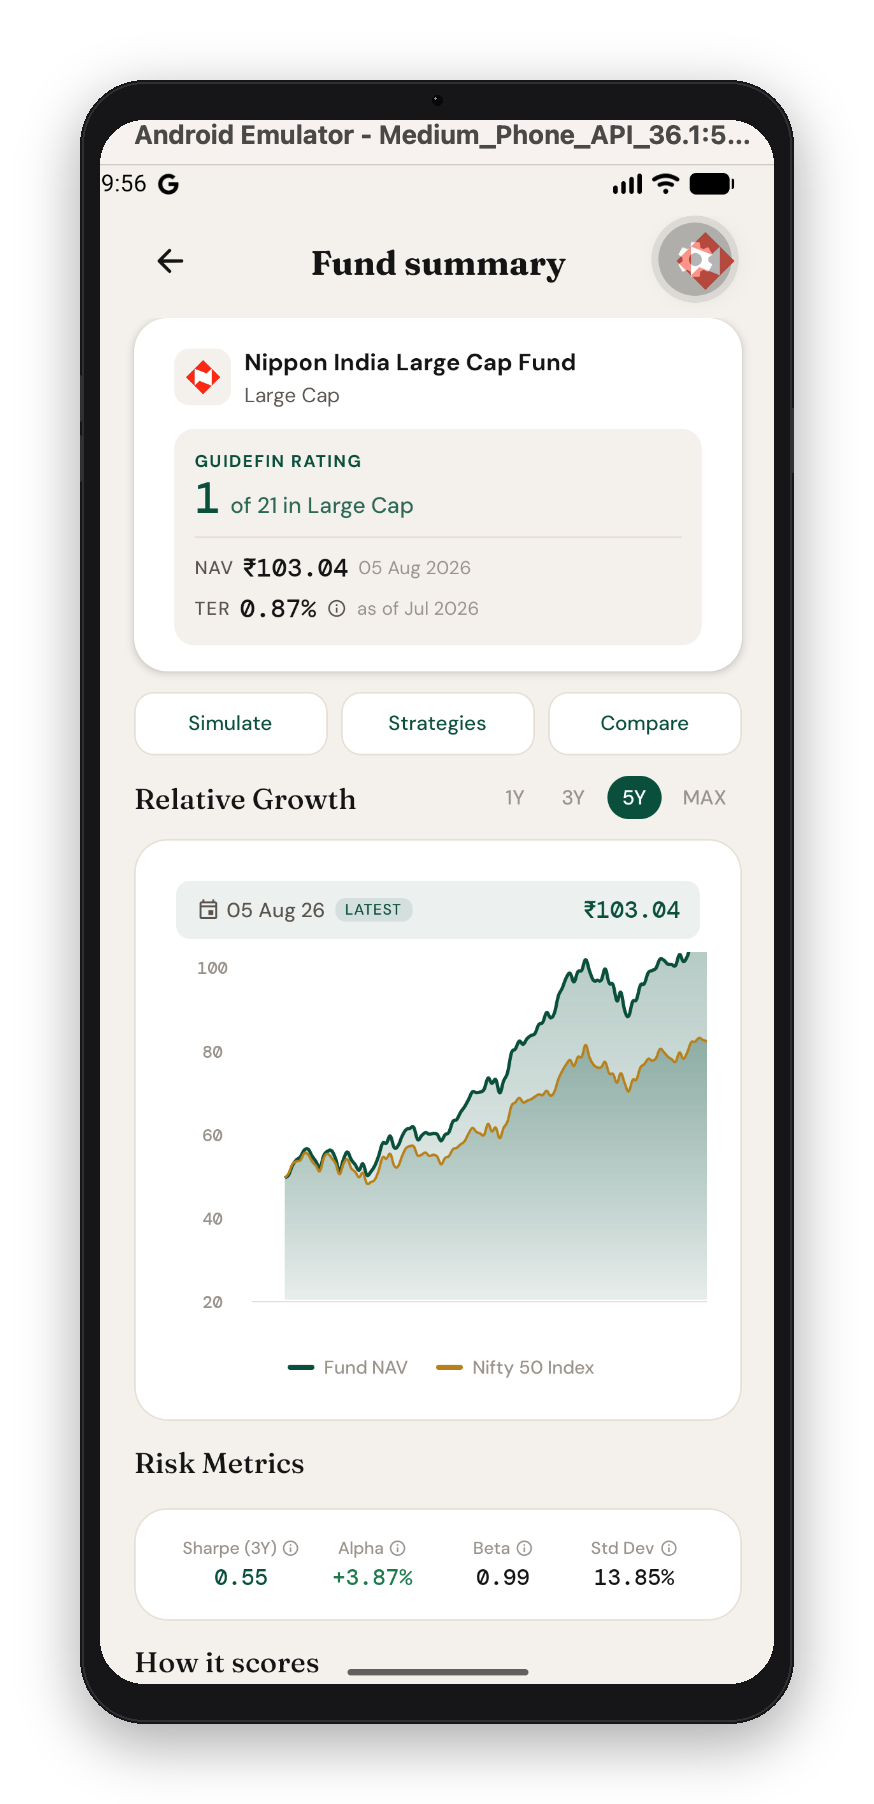
Here is what this means in practice. Take two example Flexi Cap funds. Fund A returned 24% last year. Fund B returned 16%. Most apps would rank Fund A first and stop there. But across 25 rolling windows, Fund A was brilliant in only four of them and below the category median in fifteen. Its one great year is doing all the work. Fund B stayed in the better half in 21 of 25 windows, and fell 8% less than its peers in the 2020 crash. GuideFin ranks Fund B higher, because it describes behaviour an investor can actually live with, not a single number that depends on the day you happen to check the app.
The test we ran on ourselves
This is the part that shaped the feature more than anything else. We took the fund rankings as they stood in 2022, and again in 2023. Then we checked what those funds actually returned afterward. Did the top-ranked funds go on to outperform?
Not reliably. The gap between our ranked shortlist and the plain category average stayed inside 0.6% a year, in either direction. That is small enough to be statistical noise. We also tried a simpler ranking method, in case our four-factor approach was too complicated. It did not do any better either. This result matches decades of global evidence. The best-known version is SPIVA's (S&P Indices Versus Active) persistence studies, which show that past winners, ranked almost any reasonable way, do not reliably stay winners.
We could have buried that finding. Instead, we built it into the product. The Learning Center article behind every rating explains it in plain language. The rating itself is described everywhere in the app as a shortlist to research, not a leaderboard to obey. A rating you cannot question is just a claim. So we built ours to show its work, including the parts where that work has limits.
So what is it actually good for?
It turns 40 funds in a category into a shortlist of 5 that have behaved sensibly, each with a stated reason attached. And it does this without churning your portfolio every time a fund has one strong quarter. That is a smaller claim than "we will find you the winners." But it is a claim we can back with data.
Two design choices follow from that honesty. First, the shortlist barely moves. A fund only enters the top five at rank 4 or better, and only leaves once it drops to rank 8 or worse. This means ordinary month-to-month noise does not trigger a switch that would cost you exit loads and capital gains tax. Second, when two funds are too close to call, GuideFin breaks the tie on expense ratio, not on a tiny difference in past return. Cost is the one input that is guaranteed to reach you every year and compound. Past return is not a promise of anything.
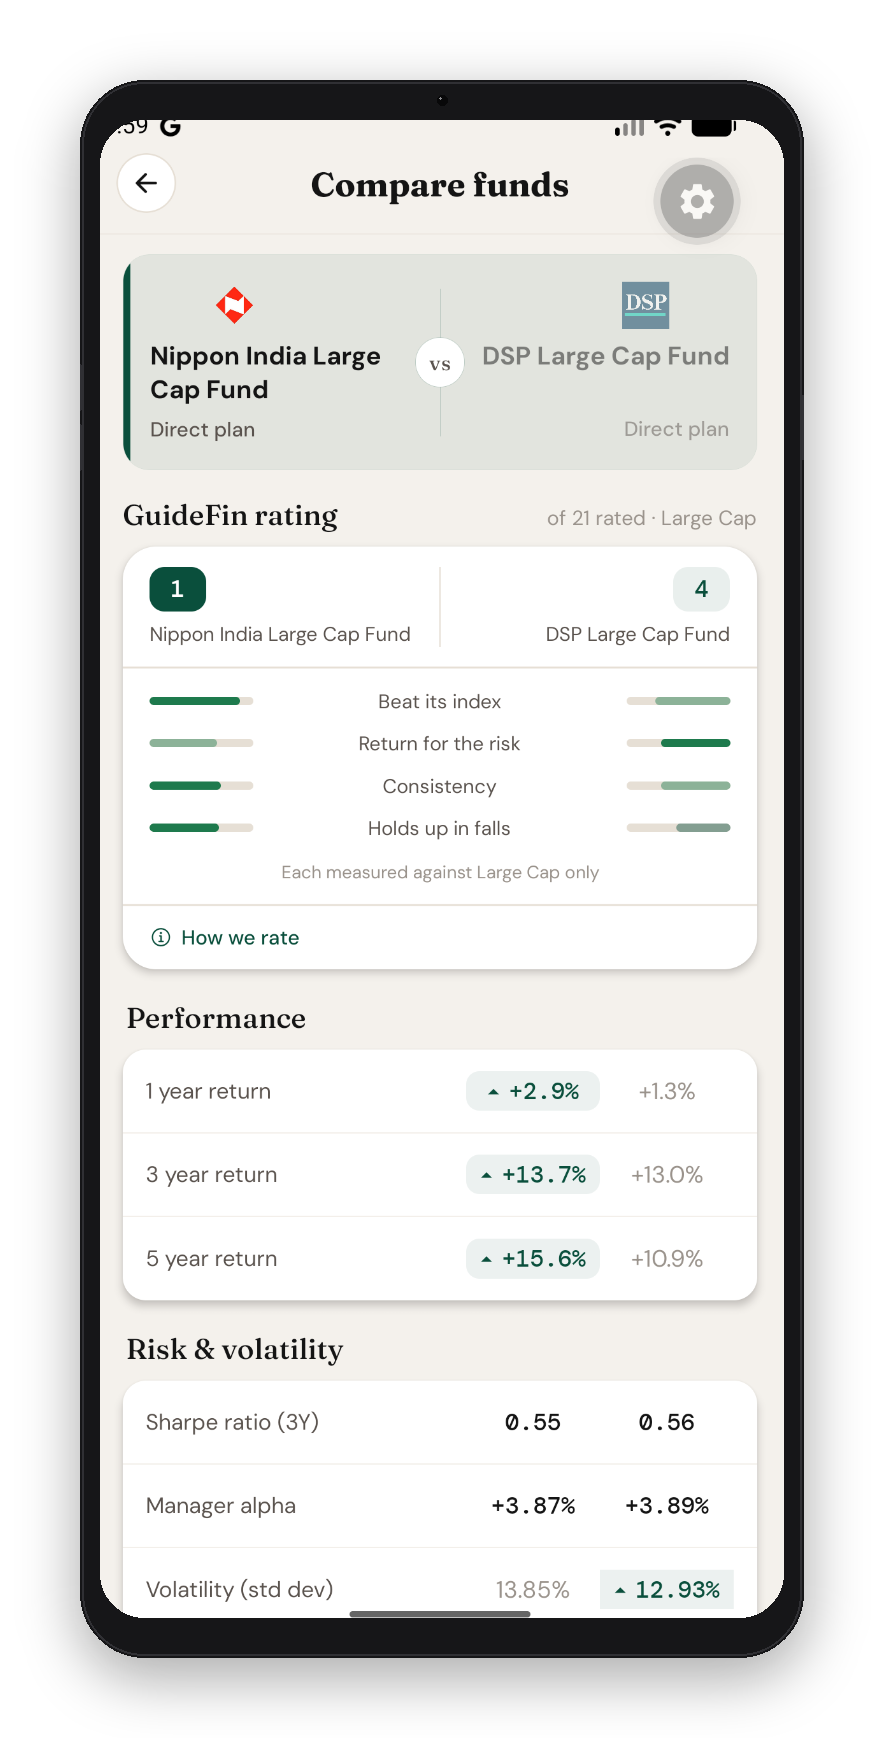
The rating also does not hide its own disagreements. GuideFin's Compare screen places the two funds' rank badges and factor bars side by side. They are mirrored around the centre, so both sides read outward and stay easy to compare. Below is an example: Nippon India Large Cap (rank 1) against DSP Large Cap (rank 4). Here, Nippon leads on both returns and rating, so the two views agree. That is the ordinary case. It is the disagreement case that actually shaped the design. We once found a pairing where the rated leader in a category trailed on more than half the standard trailing-return numbers, against a fund ranked a few places lower. The lower-ranked fund's edge came almost entirely from the most recent year. Our rating, on the other hand, scores about 25 rolling 3-year windows, and asks who was ahead more often across all of them. Rather than let the two views quietly disagree, the Compare screen shows the rated leader and adds a plain-language note whenever this happens.
A few honest limits are worth stating plainly. Only funds with at least a three-year track record get rated. That is roughly 268 of the about 1,206 actively tracked schemes as of this build. A fund with no rating is a gap in our data, not a judgement on the fund. Debt funds are left out of ranking on purpose.
The same honesty, applied to NPS
The same thinking carries into GuideFin's NPS module. Explore NPS ranks pension fund managers within each asset class (Equity, Corporate Debt, Government) using the same peer-relative logic. A manager is labelled "Ahead of peers," "In the pack," or "Behind peers." Each label comes with a one-line reason, such as "Falls less than peers in bad months" or "Ahead of peers in 25 of 25 periods."

Where to find it
Open any fund's page in the Mutual Fund Insight section and you'll see its category rank, or "Not rated yet" with a plain-language reason. Tap "How we rate" to see the four-factor breakdown for that specific fund. On the Compare screen, the GuideFin Rating section sits above the metric-by-metric table, with a note whenever the two views disagree.
Most fund-ranking features in Indian fintech apps exist to make a decision look easy. We built ours to make a decision easier to reason about including admitting the parts where a rating, no matter how carefully built, cannot see the future. That's a harder story to tell than "our AI picks winners." We think it's the more useful one.
Download : Download on Google Play
Responses (0)
Leave a response
Related Articles
GuideFin: A Real Plan Not Just Another Investment App
Why the middle class Indian investor doesn't need another place to invest. They need a clear plan, and an honest way to …

Goal Based Investing vs Return-Based Investing: Which One Actually Makes You Rich?
The Question Everyone's Asking (And the Better One You Should Be)Jump into any investing group on WhatsApp or Reddit Ind…